In the third article of our competitive pricing series, Business Consultant, Daniel Cakora highlights how you can calculate a sales-weighted price difference between you and your competitors.
Visualizing and interpreting competitive price data can be a complex task. That’s why we’ve dedicated an entire series to it. Before you read the rest of this article, consider checking out the others. The first article illustrates how to visualize trends in competitive data. The second article discusses how to interpret price and sales data to understand where you stand in the market.
It never fails: As soon as leadership hears that you’re doing competitive intel work, they’ll ask you to boil down all the data you’ve collected and nuance of interpretation into the number. Instead of charts and graphs, they want one singular figure to explain where you are priced relative to the competition. Great, how do you do that?
In this article, I’ll show you how to calculate a sales-weighted price difference between you and your competitors, so you can give your boss the number.
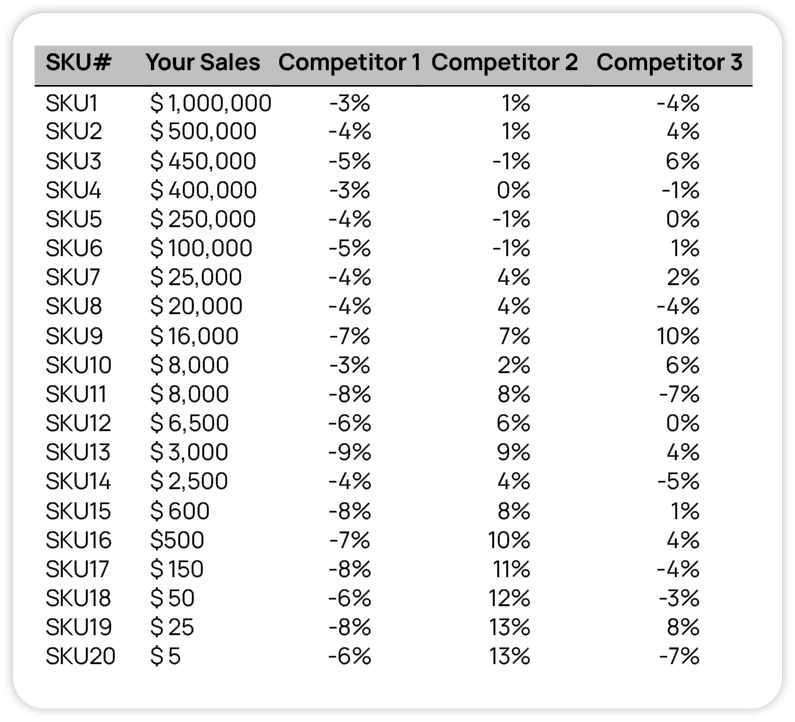
Let’s begin with the data table I showed in the second article:

How To Calculate the Sales-Weighted Price Difference
We have SKUs, our sales, and price differences between us and three competitors. For each competitor, let’s calculate the sales-weighted price difference. The formula to do so:

There are two key reasons for using a weighted average rather than a simple average to calculate the sales-weighted price difference:
- A simple average is more susceptible to outliers than a weighted average. If, for some reason, there is a huge discrepancy in price between you and your competitor, it will unduly skew the simple average. The weighted average is a truer measure of reality.
- The weighted average gives greater importance to SKUs with higher sales. SKUs with higher sales are usually more important to your boss, so this calculation gives your boss what he or she needs, which is information on the most important SKUs.
Single Competitor Sales-Weighted Price Difference Table
On to the calculation. Here’s a table that shows how to compute a sales-weighted price difference for one competitor.

Bottom Line: Competitor 1 is on average priced 3.73% below me from a sales-weighted price perspective.
- The Sales Weight column shows the sales for each individual SKU divided by the Sales Total for all SKUs. For example. SKU1 has a sales weight of $1,000,000 / $2,790,330 = 35.8% while SKU 8 has a Sales Weight of $20,000 / $2,790,330 = 0.7%. Note that the sum of the Sales Weight column adds up to 100%, which makes sense. 100% of the individual SKU sales = 100% of the total sales.
- As discussed in previous articles, the Competitor Price Delta Calculation is [(Competitor Price)/(My Price)-1]*100%.
- The Weighted Price Delta, which is calculated for each line item, is Sales Weight * Competitor Price Delta. The summation of all the line items of the Weighted Price Delta column is -3.73%. In other words, Competitor 1 is on average priced 3.73% below me from a sales-weighted perspective.
It’s a best practice to provide context to a single figure such as a sales-weighted average, so I usually provide a range to give the boss context. I frequently provide the minimum and maximum weighted price differences (3.73% average, with range of -3% to -9%).
The great thing about the sales-weighted price difference formula is that it can be calculated for multiple competitors, or even multiple product families within a given competitor. So for Product Family A your competitors may be 2% below you, while in Product Family B they are 3% above. The level of granularity of the calculation depends on the situation, but you now have the tools to compute it however your boss needs to see it.
Set and Manage Competitive Prices with Vendavo
Setting your competitive pricing strategy is one side of the coin, but the other side of the coin lies in the execution. Vendavo Pricepoint helps you execute straightforward, scalable price management across your organization. With Vendavo, you’ll improve pricing agility and stay ahead of changing market dynamics.
